|
| I've been wanting to know just what were our electricity consumption patterns for a number of years now. When we were in Conservation Co-op, our usage was around 6.5kWh/day. When I started running Linux servers that were on 24/7 and working on FreeS/WAN, that pattern changed up to mid-20s kWh/day. I knew this would be a cost of that activity, but didn't know exactly what to expect. Since then, we have married, moved twice and had two children. The pattern doesn't seem to have changed that much. We took the opportunity to buy a gas stove when the one supplied with our first house was mostly dead from the start, so that ceased to be an issue. We do now have an electric hot water heater though. |
|
I bought a Home Hardware EM130 single circuit power meter more than a year ago to start finding out a bit more detail. It was used to monitor the power consumed by the main computer rack in the basement running the Linux servers. The power consumed was a bit lower than I expected, but still high enough to be of concern at 850W.
We have been buying electricity from BullFrog Power for a couple of years now to at least mitigate some of the issues with electricity generation. Their power is purchased from green sources such as wind and biogas.
HydroOttawa brought in Time-Of-Use metering this past summer, which also helped starting to identify *when* that power was being used, with one hour resolution. At first, I was intrigued and puzzled by the information, but after looking at the data, some obvious patterns emerged. One was that our base load was higher than I expected, ranging from 1.2-1.4kW. There were also peaks of 4kW for periods of 1/2h to 4h, some during the day, others near midnight. They turned out to be the hot water heater, after some reflection and discussion with Carole.
I had started looking at commercially available systems to do this for more than one circuit sometime last spring. As expected, they were somewhat pricey. There are lots of single-sensor solutions. Even DIY solutions I found at the time were expensive or were single-sensor hacks based on current-clamp DMMs. The non-invasive clamp-on current transformers I had found were all in the order of $40 to $150 each. For two incoming lines and 36 branch circuits, that would be $1600 in sensors alone, never mind data collection. I found commercial Power Distribution Units (power bars) with individual monitoring per receptacle that were up around $500 for 6-8 circuits. I had also been wrestling with the idea of doing power data integration over time in hardware along with phase detection for power factor calculations, making for a relatively high parts count. I hadn't thought that the microcontroller would be powerful enough to do that integration over time.
We just had a microFIT residential rooftop photovoltaic system (solar panels) installed around the new year and it is supplied with fairly good monitoring. It has inspired me to follow through with monitoring and trying to reduce our electricity usage.
It was in the process of attempting to re-patriate my solar power generation data from the inverter supplier company that I became aware of much less expensive options at OpenEnergyMonitor. In particular, starting with split-core current transformers that were around $10 each. The system uses an Arduino, of which I had already been planning to use since I had a couple for project development.
I started hacking code from "Desert Home"'s How I Monitor Power. His code was based on emon which I found through here. I'm also looking at adding a control to shut off the water tank during peak hours like this.
I bought a second power meter for $20, this one a Blue Planet EM100, for calibration purposes.
2012-03-01: an Arduino Uno connected to 4 current sensors, collecting data from "line voltage", "line frequency", "mains power" for two legs, and "power" for two sub-circuits.
2012-03-05: added a second Uno connected to 4 current sensors, collecting data from "power" for four more sub-circuits.
2013-03-10: replaced the two Uno with one Teensy3.0 collecting data from "line voltage", "line frequency", "mains power" on both legs, "power" on 10 sub-circuits (I'm still missing 4 current sensors).


There was a large imbalance between the loads on the two phases, which may have been causing some of the dropouts in communications between the microinverters and the communications gateway for the solar panels. I've corrected this by splitting the computer rack. I've identified most of the big loads. The microwave, kettle, toaster oven also use a fair amount, but their duty cycles are small enough that I won't worry too much about them at this point.
I've adapted the eMon Arduino code to support 4 current sensors at once and rewritten the loop code to use integers to be faster. I could have done 6 per Arduino since it has 6 analog inputs, but chose to use one input for the voltage divider reference monitoring and one for the line voltage monitoring. I wrote some perl to collect that data from two USB-connected Arduino at once and feed that data to RRDtool.
I've started a git repo for the source... smart_panel
Next steps include considering the Arduino Mega 2560 with 16 analog inputs which is limited to 10-bit ADC and 16MHz or something like the ARM-based Xduino with 16 12-bit ADCs but running at 72MHz.
Photos:
Rev 1 HW:
This rev only made it to Arduino-connected breadboard, monitoring voltage, two mains currents and two sub-circuits
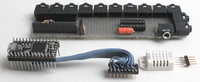
Rev 2 HW:
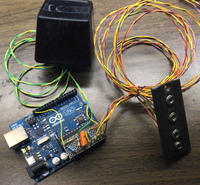 This rev made it to an Arduino custom mini-shield, monitoring 4 sub-circuits.
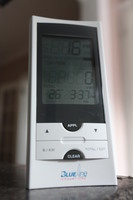 As PeakSaver participants, we were offered a PowerCost Monitor,
with its corresponding borg-like attachment to our load meter.
As PeakSaver participants, we were offered a PowerCost Monitor,
with its corresponding borg-like attachment to our load meter.
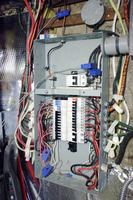
Rev 3 HW:
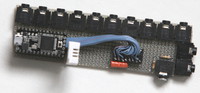 This rev migrated to a Teensy3.0, monitoring voltage, two main currents, 10 sub-circuit currents, humidity and temperature.
Links: